Unit 3, Vital Signs Essential Question:
How are the 5 vital signs measured and what can we learn from those measurements?
To do this you must be able to answer the following:
Why is it important for me to learn about vital signs? Below the state of South Carolina feels that you should know the following information. Highlight these standards on your list of HST 2 standards in the front of your notebook.
SC Foundation Standard: Technical Skills
10.1 Apply procedures for measuring and recording vital signs (blood pressure, height, and weight) including recognition of normal ranges and understanding what the data means.
How are the 5 vital signs measured and what can we learn from those measurements?
To do this you must be able to answer the following:
- What is temperature? pulse? respiration? pain scale? blood pressure?
- How are they measured?
- How are those measurements recorded?
- What are abnormal measurements?
- What do abnormal measurements mean?
Why is it important for me to learn about vital signs? Below the state of South Carolina feels that you should know the following information. Highlight these standards on your list of HST 2 standards in the front of your notebook.
SC Foundation Standard: Technical Skills
10.1 Apply procedures for measuring and recording vital signs (blood pressure, height, and weight) including recognition of normal ranges and understanding what the data means.
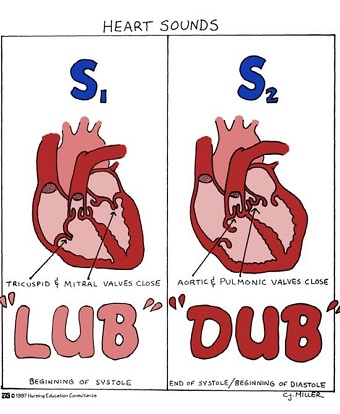
VS #1 - Blood Pressure (BP, B/P) |
| ||
|
Practice listen for the systolic then the diastolic sounds by using Ohio State University's BP Assessment link below. You will also be able to practice reading the dial on the sphygmomanometer.
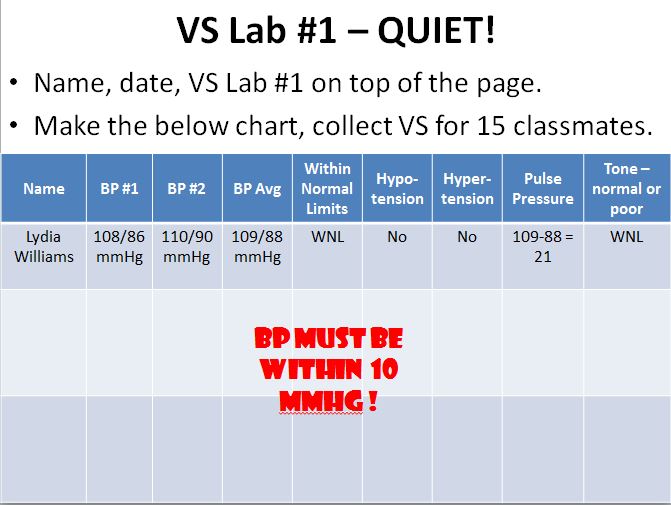
Vital Signs Lab #1 - Recording Blood Pressure
We will spend today in the lab. In order for this lab to be successful you must keep the classroom volume down. If the lab gets too loud you will not be able to hear the systolic (first sound) and diastolic sounds (second sound).
- Turn a sheet a paper sideways (landscape). Write your name, date and VS Lab #1 across the top.
- Draw the chart below with 9 columns and 16 rows.
- You are to record the BP reading of 10 classmates. You will take two readings then average the two together.
- Next determine if the average reading is within normal limits (100-140/60-90), hypotensive (<100/60), or hypertensive (>140/90).
- Finally, determine the pulse pressure by finding the difference between the systolic and diastolic readings. Identify whether the pulse pressure is normal (the arterial walls are in good health) or abnormal (the arterial walls are in poor health).
How to draw the heart: |
| ||
VS #2 - Pulse (P) |
| ||
VS Lab #2 BP and P
Using a TPR Graph, record the pulse and blood pressure for two of your given classmates.
|
Des'rae - Emily, Bailee
Matthew - Kierra, Michayla Kiesha - Meg, Anna Zakiya - Dakota, Jenny Alaysia - Stephen, Katie Dakota - Liz, Sarahi Liz - Jordan, America Anna - Nakya, Mayah Katie - Des'rae, Matthew Mayah - Bailee, Stephen |
Michayla - Sarahi, Nakya
Bailee - Liz, Kierra Stephen - Kiesha, Jordan Meg - Alaysia, Jenny Jenny - Kierra, America Sarahi - Emily, Michayla Jordan - Meg, Dakota Kierra - Anna, Stephen America - Katie, Mayah Emily - Des'rae, Alaysia Nakya - Liz, Zakiya |
VS #3 - Respirations |
| ||
VS #4 Temperature |
| ||
Students - I am filling in for an administrator today so I need you to please responsible in getting this work done, and respectful to your Substitute teacher.
Below is a warm-up and notes over our next vital sign, Temperature. Complete the warm-up and copy the notes into your notebook. When you have finished. Complete VS Lab #4 the same we have done the previous two on your TPR Graph. This time however, you will add body temperature. Place a PO next to the reading and closed dot on the graph as well as the measured temperature reading. You will do this for your two assigned patients. If one of your patients is not here, then you may pick another student to document. Have that student initial the bottom of the Day 2 column so that I will know where there is a sudden change in readings. If this is unclear then look how I have initialed the bottom of columns when others have been previously out. Be sure to document:
Below is a warm-up and notes over our next vital sign, Temperature. Complete the warm-up and copy the notes into your notebook. When you have finished. Complete VS Lab #4 the same we have done the previous two on your TPR Graph. This time however, you will add body temperature. Place a PO next to the reading and closed dot on the graph as well as the measured temperature reading. You will do this for your two assigned patients. If one of your patients is not here, then you may pick another student to document. Have that student initial the bottom of the Day 2 column so that I will know where there is a sudden change in readings. If this is unclear then look how I have initialed the bottom of columns when others have been previously out. Be sure to document:
- BP, T, P, R readings
- Military time
- Date and Day in Lydia Williams Memorial Hospital
VS #5 - Pain Scale (degree of pain) |
| ||

|

|
